 |
| (Material) |
| Trends of cruises, etc. in Japan in 2004 |
 |
 |
Graph 1: Trend in number
of passengers of oceangoing and coastal water cruises |
|
| (Unit: 1 person) |
| Year |
Oceangoing
cruises |
Coastal
water cruises |
|
| Ships
operated by Japanese shipping lines |
Ships
operated by foreign shipping lines |
Subtotal |
Compared
to the previous year |
Oceangoing
cruise ships |
Coastal
water ferries |
Subtotal |
Compared
to the previous year |
Total |
Compared
to the previous year |
| 1989 |
36,200 |
21,900 |
58,100 |
32.6% |
95,700 |
- |
95,700 |
6.5% |
153,800 |
15.0% |
| 1990 |
38,100 |
28,600 |
66,700 |
14.8% |
108,200 |
- |
108,200 |
13.1% |
174,900 |
13.7% |
| 1991 |
38,300 |
25,600 |
63,900 |
-4.2% |
102,200 |
- |
102,200 |
-5.5% |
166,100 |
-5.0% |
| 1992 |
46,400 |
30,400 |
76,800 |
20.2% |
120,300 |
- |
120,300 |
17.7% |
197,100 |
18.7% |
| 1993 |
47,300 |
32,800 |
80,100 |
4.3% |
134,100 |
- |
134,100 |
11.5% |
214,200 |
8.7% |
| 1994 |
42,500 |
31,400 |
73,900 |
-7.7% |
134,200 |
- |
134,200 |
0.1% |
208,100 |
-2.8% |
| 1995 |
45,100 |
34,400 |
79,500 |
7.6% |
145,500 |
- |
145,500 |
8.4% |
225,000 |
8.1% |
| 1996 |
34,400 |
39,400 |
73,800 |
-7.2% |
119,900 |
- |
119,900 |
-17.6% |
193,700 |
-13.9% |
| 1997 |
33,300 |
49,000 |
82,300 |
11.5% |
95,400 |
7,900 |
103,300 |
-13.8% |
185,600 |
-4.2% |
| 1998 |
26,700 |
46,100 |
72,800 |
-11.5% |
97,700 |
5,200 |
102,900 |
-0.4% |
175,700 |
-5.3% |
| 1999 |
22,700 |
48,100 |
70,800 |
-2.7% |
92,900 |
5,600 |
98,500 |
-4.3% |
169,300 |
-3.6% |
| 2000 |
21,100 |
109,400 |
130,500 |
84.3% |
83,400 |
2,000 |
85,400 |
-13.3% |
215,900 |
27.5% |
| 2001 |
18,400 |
96,900 |
115,300 |
-11.6% |
81,600 |
3,200 |
84,800 |
-0.7% |
200,100 |
-7.3% |
| 2002 |
18,600 |
74,800 |
93,400 |
-19.0% |
73,000 |
2,300 |
75,300 |
-11.2% |
168,700 |
-15.7% |
| 2003 |
10,100 |
48,700 |
58,800 |
-37.0% |
77,800 |
3,400 |
81,200 |
7.8% |
140,000 |
-17.0% |
| 2004 |
15,600 |
57,700 |
73,300 |
24.7% |
82,900 |
3,800 |
86,700 |
6.8% |
160,000 |
14.3% |
|
Survey by MLIT, Maritime
Bureau, International Shipping Division ( same below)
| (Notes) |
| 1. |
Includes fly-and-cruise
besides Japan departure/arrival cruises |
| 2. |
The questionnaire
excludes redundancies from Japanese shipping companies,
branch offices and agencies of foreign shipping lines,
and general travel agents. |
| 3. |
The survey
was started in 1997 covering coastal water cruises by
domestic ferries |
| 4. |
Because fractions
are rounded, some totals may not add up completely. |
|
|
|
 |
Graph 2: Objectives
of oceangoing cruises |
|
| Objective |
2001 |
(Share) |
2002 |
(Share) |
2003 |
(Share) |
2004 |
(Share) |
| Leisure |
102,400 |
88.8% |
83,800 |
89.7% |
55,400 |
94.1% |
66,200 |
90.3% |
| (Japanese shipping
lines) |
6,200 |
5.4% |
9,000 |
9.6% |
6,700 |
11.4% |
8,400 |
11.5% |
| Incentive |
1,500 |
1.3% |
0 |
0.0% |
0 |
0.0% |
0 |
0.0% |
| Seminar |
2,800 |
2.4% |
3,900 |
4.2% |
1,900 |
3.2% |
3,800 |
5.2% |
| Group travel |
1,400 |
1.2% |
3,100 |
3.3% |
1,000 |
1.7% |
700 |
1.0% |
| Exchange |
7,200 |
6.2% |
2,600 |
2.8% |
600 |
1.0% |
2,600 |
3.5% |
| Total |
115,300 |
100.0% |
93,400 |
100.0% |
58,900 |
100.0% |
73,300 |
100.0% |
|
The passengers on ships
operated by foreign shipping lines all regard their objective simply
as leisure, according to the result of questionnaires to Japanese
shipping lines.
| (Notes) |
| 1. |
Incentive
refers to trip invitations or bargain trips offered by
companies to stores or employees. |
| 2. |
Group travel
refers to company trip or school excursion (these have
been counted in separate categories since 1997). |
|
|
|
 |
Graph 3: Objectives
of coastal water cruises |
|
| (Unit: person) |
| Objective |
2002 |
(Share) |
2003 |
(Share) |
2004 |
(Share) |
| Leisure |
50,800 |
67.5% |
57,800 |
71.2% |
71,700 |
82.7% |
| (One-night) |
15,400 |
20.5% |
14,400 |
17.7% |
21,800 |
25.1% |
| Incentives |
7,400 |
9.8% |
4,200 |
5.2% |
3,100 |
3.6% |
| Seminars |
6,800 |
9.0% |
7,500 |
9.2% |
6,000 |
6.9% |
| Group travel |
9,700 |
12.9% |
10,000 |
12.3% |
5,900 |
6.8% |
| Exchange |
600 |
0.8% |
1,700 |
2.1% |
0 |
0.0% |
| Other |
0 |
0.0% |
0 |
0.0% |
0 |
0.0% |
| Total |
75,300 |
100% |
81,200 |
100% |
86,700 |
100% |
|
Since it is based on the
results of questionnaires aimed at Japanese shipping lines, this covers
passengers on oceangoing cruise ship operated by Japanese shipping
lines and on coastal water cruises of ferries.
| Note) |
| 1. |
Incentive
refers to trip invitations or bargain trips offered by
companies to stores or employees. |
| 2. |
Group travel
refers to company trip or school excursion (these have
been counted in separate categories since 1997). |
| 3. |
The main objectives
of exchange are visits to graves and exchange between
sister ports and cities. Therefore, this refers to goodwill
ships sponsored by government offices or citizen groups
and Japanese Youth Goodwill Cruises. |
|
|
|
 |
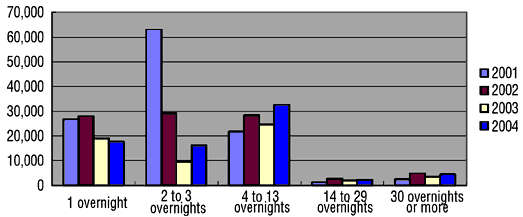
Graph 4: The number
of passengers by number of overnights on oceangoing cruises |
|
| Trend in the number of passengers
by number of overnights on oceangoing cruises (2001-2004) |
 |
|
| No. of overnights |
2001 |
(Share) |
2002 |
(Share) |
2003 |
(Share) |
2004 |
(Share) |
|
| 1 overnight |
26,700 |
23.2% |
28,000 |
30.0% |
19,100 |
32.5% |
17,800 |
24.3% |
 |
| 2 to 3 overnights |
63,100 |
54.7% |
29,200 |
31.3% |
9,600 |
16.3% |
16,200 |
22.1% |
 |
| 4 to 13
overnights |
21,800 |
18.9% |
28,500 |
30.5% |
24,600 |
41.8% |
32,600 |
44.5% |
 |
| 14 to 29
overnights |
1,200 |
1.0% |
2,800 |
3.0% |
1,900 |
3.2% |
2,300 |
3.1% |
 |
| 30 overnights
or more |
2,500 |
2.2% |
4,900 |
5.2% |
3,600 |
6.1% |
4,400 |
6.0% |
 |
| Total no. of
passengers |
115,300 |
100.0% |
93,400 |
100.0% |
58,800 |
100.0% |
73,300 |
100.0% |
| Total
of passenger-overnights |
576,400 |
|
449,200 |
|
548,900 |
|
688,745 |
|
| Average no.
of overnights |
5.0
overnights |
4.8
overnights |
9.3
overnights |
9.4
overnights |
|
Based on the results of
questionnaires airmed at the branch offices and agencies of Japanese
shipping companies and foreign ship companies and general travel agents.
The number of panssenger-overnights is the aggregate of the number
of passengers on cruises and the number of overnights. As fractions
are rounded, totals may not add up completely. |
|
 |
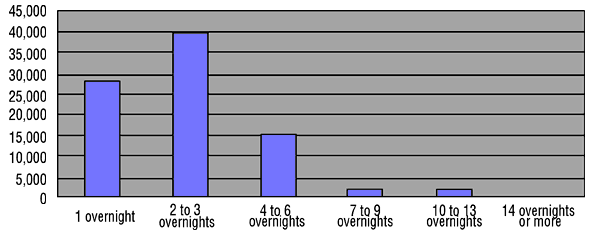
Graph 5: The number
of passengers by overnights on coastal water cruises |
|
| The number of passengers by overnights
on coastal water cruises (2004) |
 |
|
| No. of overnights |
2004 |
(Share) |
| 1
overnight |
27,800 |
32.1% |
| 2
to 3 overnights |
39,800 |
45.9% |
| 4
to 6 overnights |
15,300 |
17.6% |
| 7
to 9 overnights |
1,900 |
2.2% |
| 10
to 13 overnights |
1,900 |
2.2% |
| 14
overnights or more |
0 |
0.0% |
| Total
no. of passengers |
86,700 |
100.0% |
| Total
of passengers, overnights |
231,300 |
| Average
no. of overnights |
2.7
overnights |
|
 |
Based on the
results of questionnaires to Japanese shipping companies (cruise shipping
lines and coastal service ferries).
The no. of panssengers, overnights is the product of the
no. of passengers on each cruise and the no. of overnights.
Some totals may not completely add up as fractions are
rounded.
The study was started in 2001. |
|
 |
Graph 5-2: Trend in
number of passenger-overnights of cruises in coastal waters (oceangoing
cruise ships) |
|
| No.
of overnights |
2002 |
2003 |
2004 |
| No.
of passengers |
73,000 |
77,800 |
82,900 |
| Total
of panssengers, overnights |
185,700 |
219,600 |
225,200 |
| Average
no. of overnights |
2.5 |
2.8 |
2.7 |
|
Based on the results of
questionnaires to Japanese shipping companies (ocean-going cruise
shipping lines).
The no. of passengers, overnights is the product of the no. of passengers
on each cruise and the no. of overnights.
Some totals may not completely add up as fractions are rounded. |
|
 |
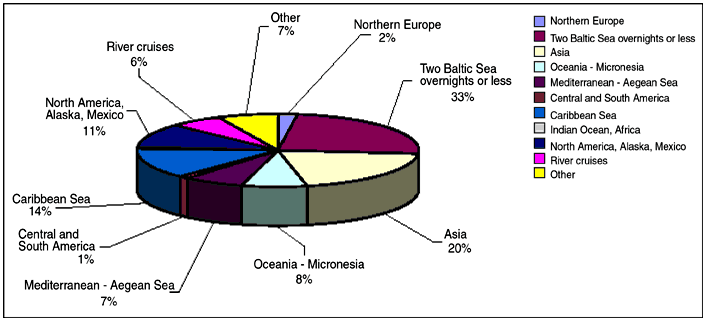
Graph 6: No. of passengers
by area on oceangoing cruises in 2004 |
|
| (Unit: person) |
| Area |
2002 |
2003 |
2004 |
| Japanese
shipping line vessels |
Foreign
shipping line vessels |
Total |
Share |
Japanese
shipping line vessels |
Foreign
shipping line vessels |
Total |
Share |
Japanese
shipping line vessels |
Foreign
shipping line vessels |
Total |
Share |
| Northern
Europe |
0 |
28,300 |
28,300 |
30.3% |
60 |
20,200 |
20,260 |
34.5% |
0 |
19,400 |
19,400 |
26.5% |
| (Within
that figure, two Baltic Sea overnights or less) |
0 |
27,400 |
27,400 |
29.3% |
0 |
19,100 |
19,100 |
32.5% |
0 |
17,700 |
17,700 |
24.1% |
| Asia |
12,900 |
15,400 |
28,300 |
30.3% |
6,100 |
5,300 |
11,400 |
19.4% |
8,300 |
6,500 |
14,800 |
20.2% |
| Oceania
- Micronesia |
3,400 |
1,500 |
4,900 |
5.2% |
1,800 |
2,600 |
4,400 |
7.5% |
4,800 |
800 |
5,600 |
7.6% |
| Mediterranean
- Aegean Sea |
0 |
4,500 |
4,500 |
4.8% |
200 |
4,300 |
4,500 |
7.7% |
0 |
4,900 |
4,900 |
6.7% |
| (Within
that figure, two Aegean Sea overnights or less) |
0 |
0 |
0 |
0.0% |
0 |
0 |
0 |
0.0% |
0 |
0 |
0 |
0.0% |
| Central
and South America |
0 |
400 |
400 |
0.4% |
0 |
700 |
700 |
1.2% |
0 |
900 |
900 |
1.2% |
| Caribbean
Sea |
0 |
4,600 |
4,600 |
4.9% |
100 |
5,300 |
5,400 |
9.2% |
0 |
10,000 |
10,000 |
13.6% |
| Indian
Ocean, Africa |
0 |
30 |
30 |
0.0% |
0 |
30 |
30 |
0.1% |
300 |
0 |
300 |
0.4% |
| North
America, Alaska, Mexico |
600 |
2,600 |
3,200 |
3.4% |
200 |
3,800 |
4,000 |
6.8% |
400 |
7,500 |
7,900 |
10.8% |
| River
cruises |
0 |
14,500 |
14,500 |
15.5% |
0 |
3,700 |
3,700 |
6.3% |
0 |
4,400 |
4,400 |
6.0% |
| (Within
that figure, Chang Jiang (Yangtze River) (down from Three Gorges)) |
0 |
12,800 |
12,800 |
13.7% |
0 |
600 |
600 |
1.0% |
0 |
1,500 |
1,500 |
2.0% |
| (Within
that figure, Nile / Lake Nasser) |
0 |
200 |
200 |
0.2% |
0 |
1,200 |
1,200 |
2.0% |
0 |
1,300 |
1,300 |
1.8% |
| (Within
that figure, Europe (Danube, Rhine, Rhone, Seine rivers)) |
0 |
600 |
600 |
0.6% |
0 |
900 |
900 |
1.5% |
0 |
900 |
900 |
1.2% |
| (Within
that figure, Russia (Volga and Don rivers)) |
0 |
700 |
700 |
0.7% |
0 |
600 |
600 |
1.0% |
0 |
400 |
400 |
0.5% |
| Others |
1,700 |
2,900 |
4,600 |
4.9% |
1,700 |
2,700 |
4,400 |
7.5% |
1,800 |
3,300 |
5,100 |
7.0% |
| (Within
that figure, round-the-world trips) |
700 |
2,100 |
2,800 |
3.0% |
600 |
2,000 |
2,600 |
4.4% |
600 |
2,400 |
3,000 |
4.1% |
| (Within
that figure, Polar regions) |
0 |
400 |
400 |
0.4% |
0 |
600 |
600 |
1.0% |
0 |
700 |
700 |
1.0% |
| Total |
18,600 |
74,800 |
93,400 |
100.0% |
10,100 |
48,700 |
58,800 |
100.0% |
15,600 |
57,700 |
73,300 |
100.0% |
|
Based on results of questionnaires
to Japanese shipping companies, branch offices and agencies of foreign
shipping lines in Japan, and general travel agents.
| (Notes) |
| 1. |
No distinction
due to registry of cruise ship or nationality of shipping
line. |
| 2. |
Total value
of Japan departure/arrival cruises and fly-and-cruise
packages. |
| 3. |
Some total
values may not add up completely as fractions are rounded. |
| 4. |
Chang Jiang
(Yangtze River) cruises, which since 2002 have been included
in figures for Asia, have been relocated in the river
cruise category and categories have been further subdivided. |
|
|
|
| Share of 2004 oceangoing cruise passengers
by sea region |
 |
|
 |
Graph 7: Trend in no.
of Japanese oceangoing passengers on regularly scheduled lines |
|
| (Unit: person) |
| Year |
Korea routes |
China routes |
Taiwan routes |
Russia routes |
Total |
| 1991 |
112,500 |
14,000 |
1,400 |
|
127,900 |
| 1992 |
98,200 |
14,400 |
1,300 |
|
113,900 |
| 1993 |
91,300 |
12,900 |
1,400 |
|
105,600 |
| 1994 |
120,900 |
11,100 |
1,300 |
|
133,300 |
| 1995 |
134,100 |
9,600 |
500 |
600 |
144,800 |
| 1996 |
130,400 |
14,200 |
600 |
1,600 |
146,800 |
| 1997 |
158,700 |
12,400 |
1,300 |
- |
172,300 |
| 1998 |
193,400 |
13,400 |
1,600 |
- |
208,400 |
| 1999 |
224,200 |
11,000 |
1,700 |
1,800 |
238,700 |
| 2000 |
257,700 |
12,200 |
1,000 |
2,200 |
273,100 |
| 2001 |
285,100 |
14,300 |
1,000 |
3,100 |
303,500 |
| 2002 |
352,700 |
18,300 |
800 |
2,900 |
374,700 |
| 2003 |
323,500 |
9,000 |
600 |
2,900 |
336,000 |
| 2004 |
440,000 |
13,100 |
800 |
2,800 |
456,700 |
|
| Based on results of questionnaires
to Japanese shipping lines and agencies of foreign shipping lines
in Japan. |
|
|