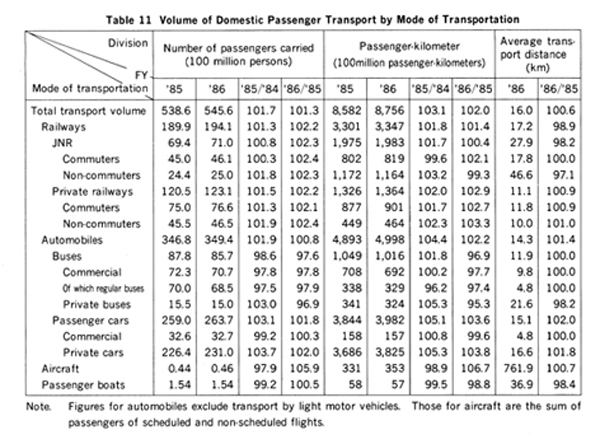
(1) Domestic Transport
Domestic passenger transport in fiscal 1986 totaled 54,560 million passengers
(an increase of 1.3% over the previous fiscal year) and 875,600 million passenger-kilometers
(an increase of 2.0%). The situation varied from transportation mode to transportation
mode, however. The growth rate of passenger transport and passenger-kilometers
was both lower than that for fiscal 1985, which was 1.7% and 3.1%, respectively.
(Table 11)
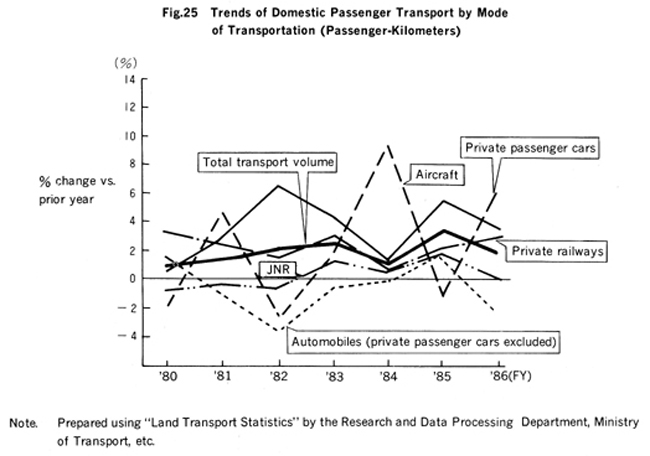
One notable characteristic of passenger transport in fiscal 1986 was that
air transport, which had shown a poor performance in fiscal 1985 due to the
effect of the crash of JAL 123 flight in August 1985, turned into an increase
and recorded a trend of revival. (Fig.
25)
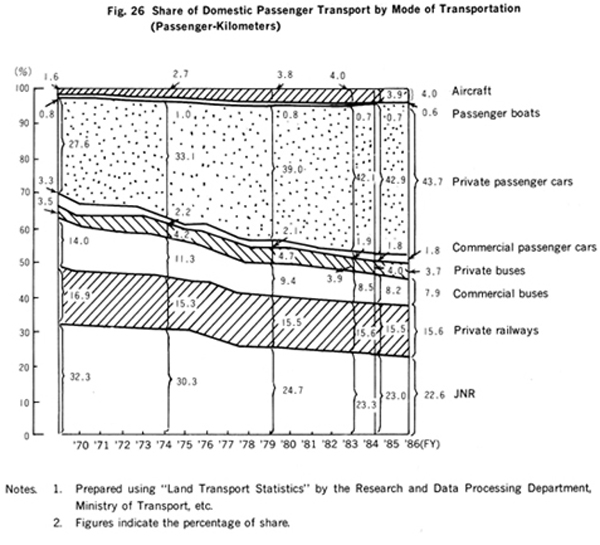
The share of private passenger cars, private railways and aircraft to the
total passenger-kilometers in fiscal 1986 was greater than that in the previous
fiscal year. The share of commercial passenger cars leveled off, while other
modes of transportation declined.
(Fig. 26) Since fiscal 1975, JNR and commercial buses have suffered decrease
in share, whereas the share of cars for private use has continued growth since
fiscal 1978, reaching 43.7% in fiscal 1986.
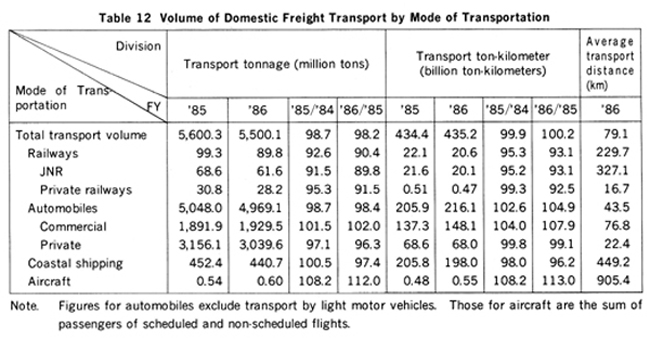
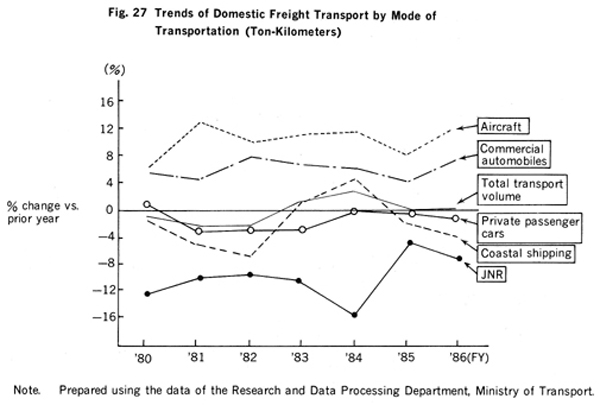
An overview of trends in domestic freight transport in fiscal 1986 shows
that the total tonnage of transport was 5,500 million tons (a decline of 1.8%
from the previous fiscal year), registering a decrease for six consecutive years,
while the total ton-kilometer of transport almost leveled off, recording 435,200
million ton-kilometers, an increase of 0.2%.
(Table 12)
In fiscal 1986, freight transport suffered a slower growth in general. In
this situation, commercial automobiles and aircraft enjoyed a greater increase,
while railways underwent a higher rate of decline and coastal shipping was stagnant.
Thus, brightness and darkness grew more remarkable according to the mode of
transportation. (Fig. 27) In addition,
the share of automobiles in terms of ton-kilometers, which had become equal
to that of domestic shipping in fiscal 1985 for the first time, exceeded that
of this shipping in 1986.
Several factors can be considered behind the recent sluggish growth of domestic
freight transport. As the position of the service industry is growing more important
in the economy as a whole and demand for service, as opposed to tangible products,
is rising, service is getting a higher position in consumers' life. In addition,
knowledge-intensive and high value-added industries are growing rapidly in the
secondary industries, and products are being miniaturized. As a result, although
Japan's real GNP has been increasing, industrial production has been stagnant
in volume, which in turn has caused freight shipment to suffer leveling-off.
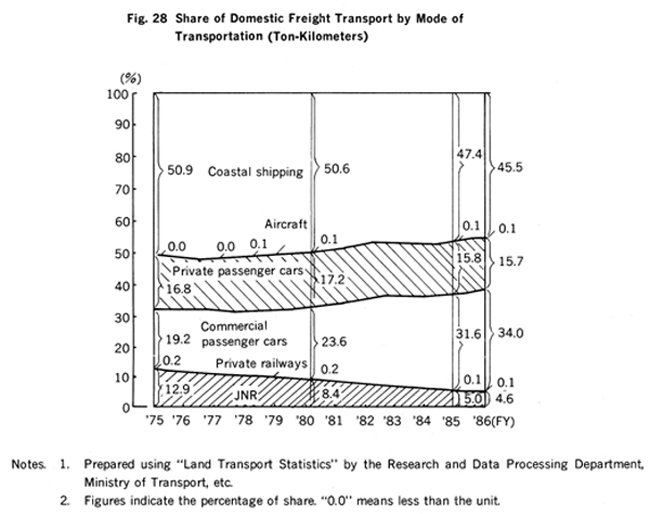
In fiscal 1986, the share of railways to the total domestic freight transport
decreased by 0.4points from the previous fiscal year to 4.7% (of which JNR suffered
a decline of 0.4points to 4.6%). The figure of automobiles increased by 2.3points
to 49.7% (of which commercial automobiles rose by 2.4points to 34.0% and private
ones dropped by 0.1point to 15.7%), while that of coastal shipping recorded
a decrease of 1.9points to 45.5%. Consequently, the share of automobiles, which
came to rank with domestic shipping first in fiscal 1985, topped that of coastal
shipping. (Fig. 28)
(2) International Transport
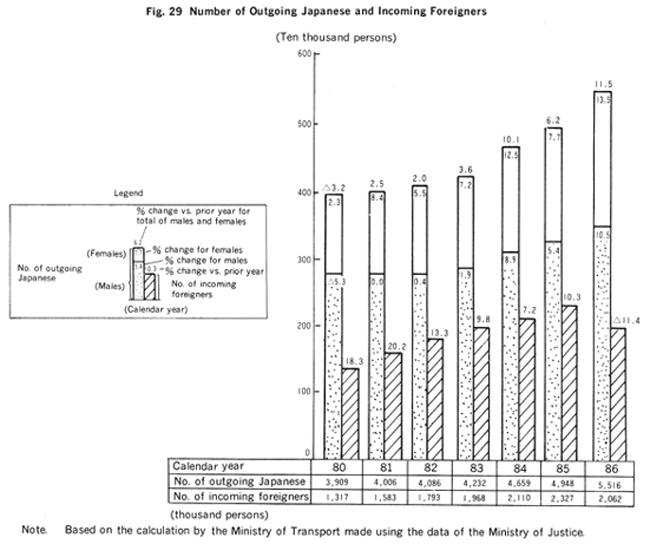
In calendar 1986, the number of outgoing Japanese increased by 11.5% over
the previous year (the growth rate was 6.2% in 1985), largely due to the effect
of strong yen. For the first time, the figure exceeded the five-million-person
mark, reaching 5,520,000 persons. Outgoing Japanese thus recorded an all-time
high for the fifth consecutive year. (Fig.
29)
The number of incoming foreigners dropped by 11.4% to 2,060,000 persons.
Behind this was the impact of yen appreciation, too. Moverover, in 1985, the
International Science and Technology Exhibition (Tsukuba Scientific Expo) attracted
many tourists from abroad, contributing to a high growth in foreign visitors
to Japan. This fact is also behind the sharp decline in these tourists in 1986.
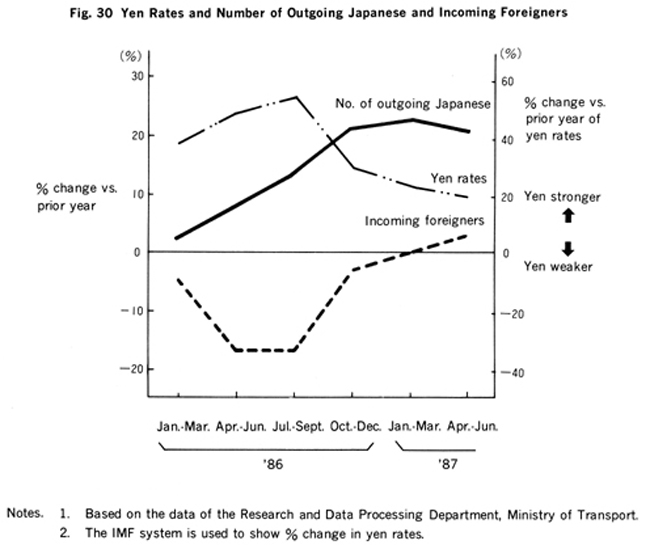
Since the Plaza Agreement, the appreciation of the yen has advanced rapidly,
and this has affected both the number of outgoing Japanese and incoming foreign
visitors greatly. The progress of yen appreciation has increased the purchasing
power of the yen in other countries, and the number of outgoing Japanese has
increased substantially. By contrast, strong yen has affected adversely the
number of foreign tourists. Some extent of interrelation can thus be observed
between the trends of outgoing Japanese and incoming foreigners and fluctuations
of yen rates. (Fig. 30)
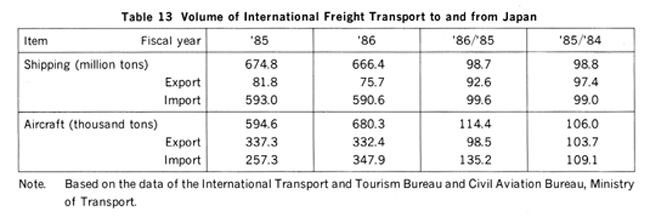
The transport of international freight by sea for export declined by 7.4%
from the previous year, following the drop a year earlier, as a result of rapid
appreciation of the yen. The figure for this freight for import suffered a decrease
of 0.4% reflecting sluggishness in domestic basic materials industries. In the
air transport of freight, export turned into a drop of 1.5%, while import enjoyed
a great increase of 35.2%. (Table
13)
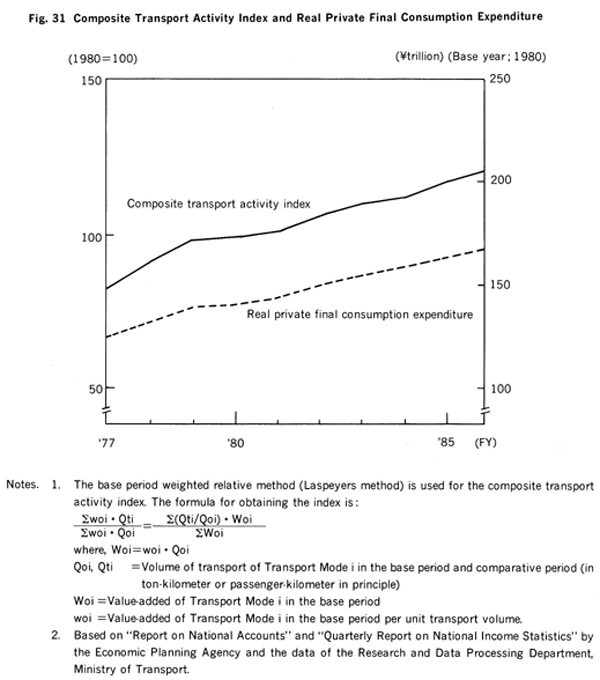
(3) Transport Activity Index
The composite transport activity index is an index obtained by evaluating
the transport volume of each means of transport in consideration of the value-added
created by the transport means. Year after year, this index is increasing, and
its trend shows a high interrelation with the change of real private final consumption
expenditure. (Fig. 31) This is
because the transport by private passenger cars, which is closely related to
private consumption, has an important position in the transport means consisting
of the transport activity index. If consumption continues a steady growth, the
composite transport activity index is likely to be on the increase in the future,
too.
Public investments in transport-related facilities in fiscal 1986, which
include special accounts, fiscal investment and loans and local independent
projects, in addition to public works expenses of the general account, totaled
\9,739,700 million, an increase of 6.5% over the previous fiscal year.
The figure is broken down to \1,196,300 million for railways (up 10.4%),
\660,200 million for ports and harbors (up 4.2%) and \271,400 million for airports
(up 25.8%).
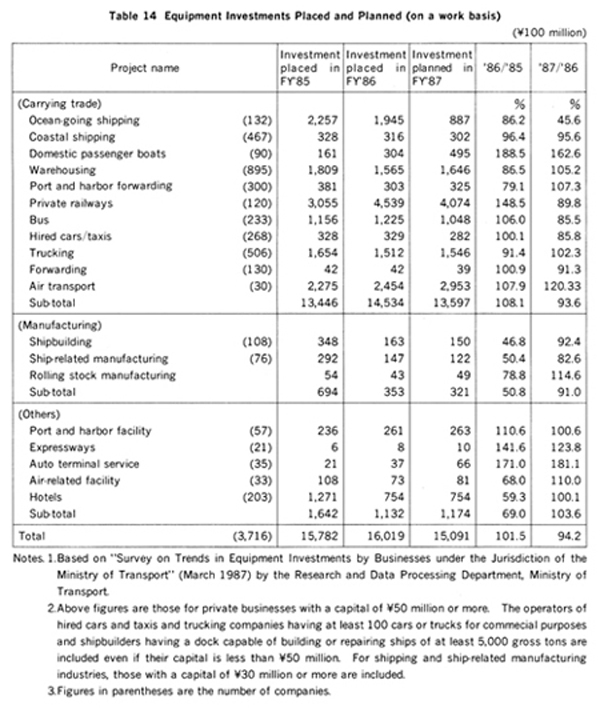
According to a survey by the Ministry of Transport, transport-related private-sector
equipment investments (3,716 firms with a capital of \50 million or more surveyed)
for fiscal 1986 totaled \1,601,900 million on a work basis. This represents
a growth of 1.5% over the previous fiscal year and the third straight increase.
(Table 14)
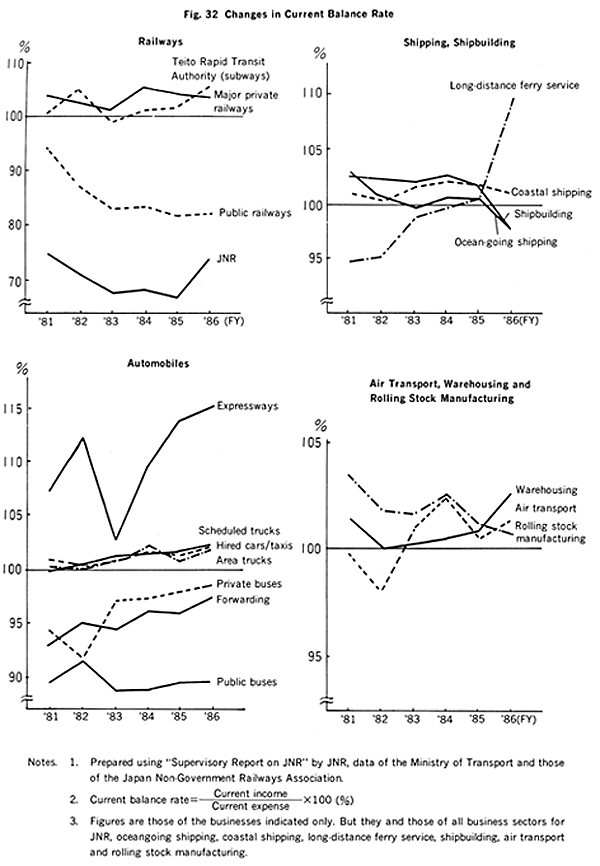
The trend of the current balance rate for the transport industry in fiscal
1986 indicates that as the growth of the Japanese economy slowed down, signs
of recovery began to appear in many industries though the situation differed
according to individual companies. Coastal shipping and shipbuilders experienced
downward business results. Air transport was getting rid of the aftermath of
the JAL 123 accident and turned into an increase in performance. (Fig.
32)
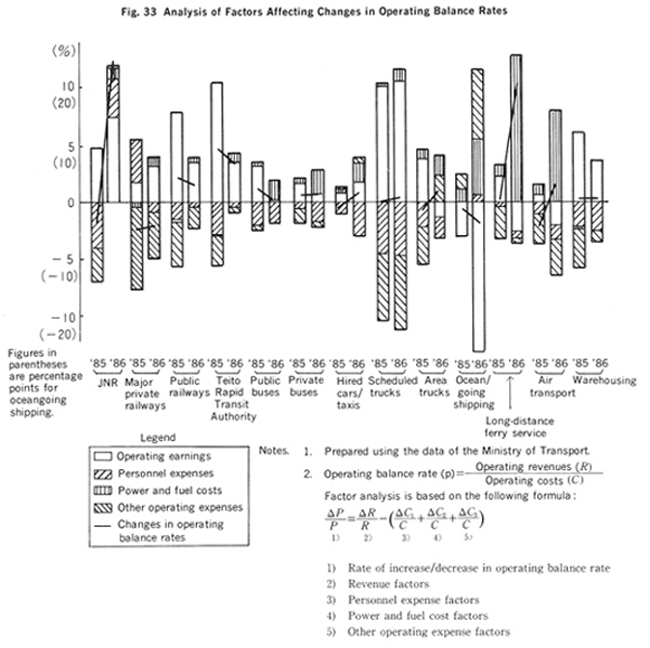
As regards business conditions in the transport sector for fiscal 1986, the
profitability headed for improvement as the operating expenses, chiefly expenses
for power and fuels, were reduced thanks to strong yen and less expensive crude
oil, though the operating income declined or leveled off.
(Fig. 33) However, transport demand did not recover enough to bring about
a substantial business revival. Moreover, since the operating balance was supported
by power and fuel costs, whose future is uncertain, profitability may be deteriorated
in the months ahead if yen rates and crude oil prices show an unfavorable movement.
Therefore, transport companies should continue efforts to save personnel and
other expenses. They will also have to redouble their endeavors to meet diversified
and advanced user needs and to increase their operating revenue.