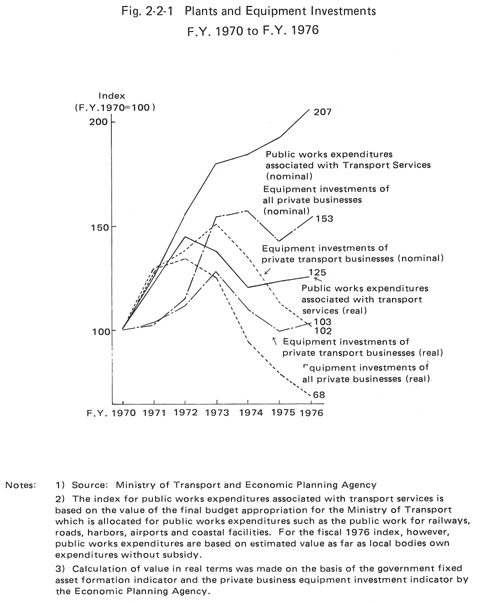
In fiscal 1976 fixed asset formation (nominal) in the transportation industry rose above the level of the previous year in public works expenditures, but fell for the third straight year in the private transportation sector. In real terms, public works expenditures increased slightly, while the expenditures by private transportation companies fell off for the fourth straight year, from fiscal 1973 when it began to decline (Figure 2-2-1).
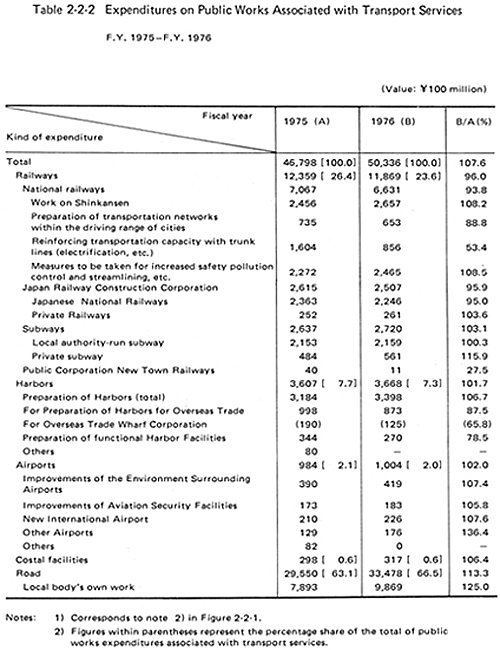
In fiscal 1976, transport-oriented public works expenditures were \5,033.6
billion, up 7.6% over the previous fiscal year (up 1.6% in real terms); increasing
in ports and harbors, airports, seashore development, and roads, except railways
(Table 2-2-2).
For the Japanese National Railways, the expenditures for safety, pollution
and streamlining were nearly equivalent to the Shinkansen work expenditures.
For airports, works expenditures on the surrounding environments were above
the total of work expenditures on the new international airport and general
airports. These two examples indicate the recent trends in transport-oriented
public works expenditures.
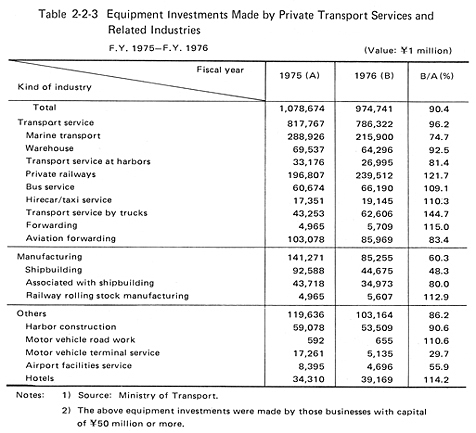
In fiscal 1976, fixed asset formation by private transportation companies
(17 sectors) was \974.7 billion, down 9.6% from the previous fiscal year. In
real terms, fixed asset formation continued to fall, down 13.4% from the previous
fiscal year. By function: fixed asset formation fell below the level of the
previous fiscal year in transportation services (9 sectors), manufacturing (3
sectors) and in miscellaneous functions (5 sectors). By sector (maritime, land
transport and aviation): investments in the maritime sectors remain sluggish,
while land transport sectors increased (Table
2-2-3).
Fixed asset formation funds procurement (in terms of disbursements) represented
\1,081.7 billion (34.1%, inside capital; 28.9%, loans from private financial
institutions; 14.7%, loans financed by government financial institutions; 9.4%,
securities and public bonds and 12.8%, other). For pirvate transportation businesses,
the percentage supplied by inside funds and securities and public bonds was
relatively low, while the percentage supplied by loans from government and private
financial institutions showed appreciable increases. Repayment of interest is
one of the great factors causing heavy pressure on management. However, when
compared with fiscal 1975, the percentage supplied by inside funds increased
by 8.9 points: the dependency on inside funds slightly increased.