PART II Transportation Under Limited Energy
Chapter 1 Stringent Energy Situation and Transportation
1. 1 International Energy Environment and Supply and Demand
of Energy in Japan.
(1) Supply-Demand Trends of International Energy and the Recurrence of Petroleum
Problem
Global petroleum production which has been stagnant since the oil crisis
of September 1973 began increasing after the economies of the oil consuming
nations headed toward a gradual recovery. However, the 1978 oil production in
all of the OPEC nations declined by 3.8% due to the political upheaval in Iran.
The oil consuming nations, recognizing the seriousness of the global energy
situation, began working out measures to cope with the problem.
(2) Energy Consumption Trends in Major Nations
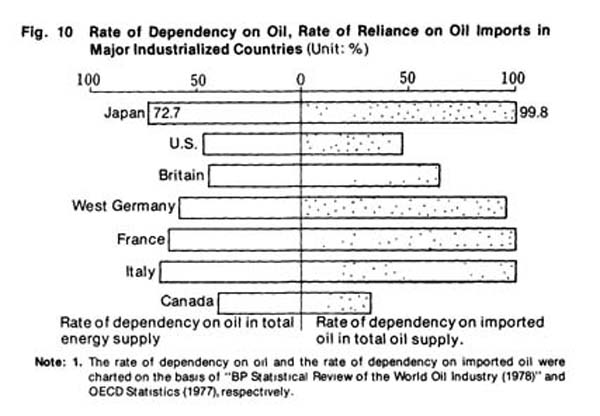
The energy supply structure in Japan is characterized foremost by its high
dependence on imports as compared with other major nations. Secondly, Japan
is heavily dependent on oil for its energy needs - and imports virtually almost
all of its oil needs. (See Figure
10.)
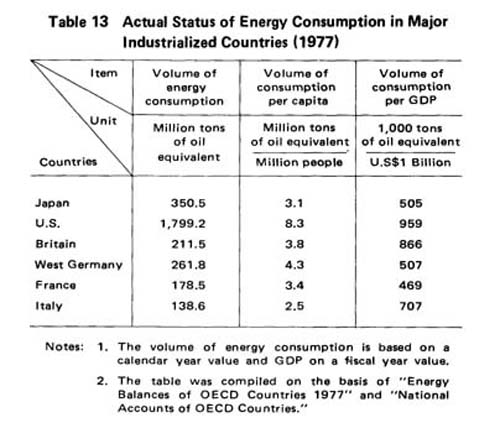
On the other hand, Japanese energy consumption is relatively favorable when
compared with the consumption levels of other nations in terms of per capita
and per GDP consumption. In absolute volume, however, Japan consumes about 10%
of the world's crude oil production. There is a strong need for Japan to promote
energy-saving programs. (See Table
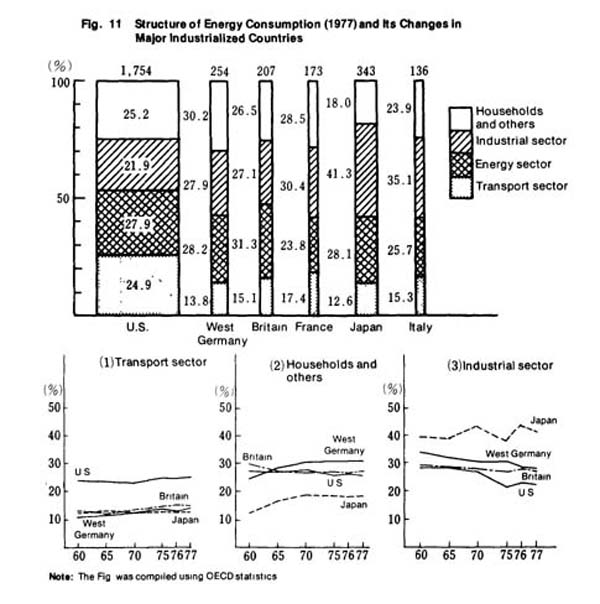
13.) Moreover, when we examine the energy-consumption structure in Japan,
we note that the share of the industrial sector is large as compared with other
industrialized nations, while households and others is small. (See
Figure 11.)
(3) Supply-Demand Trend of Energy in the Japanese Economy
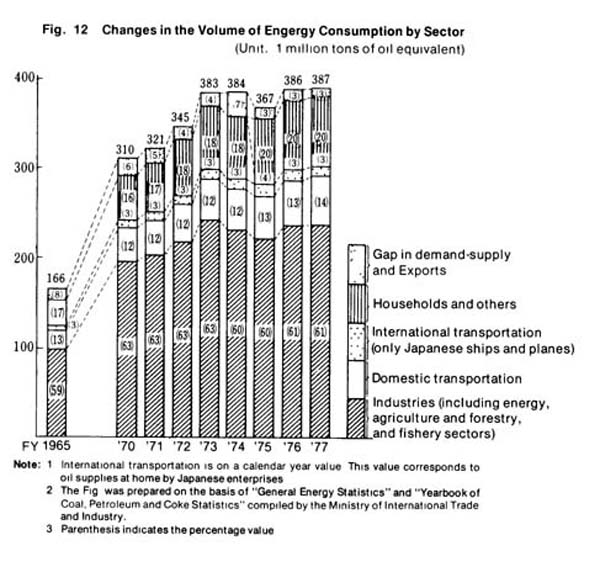
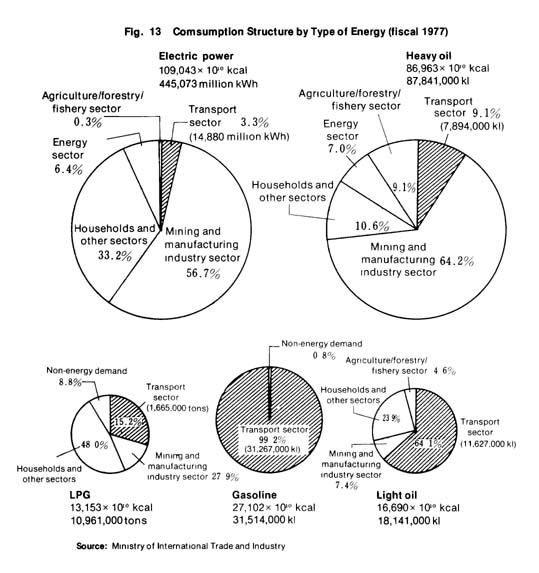
Figure 12 shows the trend
of energy consumption in Japan. The transportation sector in FY1977 accounted
for 14% of total domestic consumption (14% also in FY1978). Next, let us examine
by sector the final demand structure for each type of energy. Electric power,
which has potential options of primary energy, is used largely in the mining
and manufacturing sector and also in the consumer sector. On the other hand,
the transportation sector consumes a large amount of petroleum products like
gasoline and light oil which are consumed directly. (See
Figure 13.)
In June 1979, a Summit Conference by the major free nations was held in Tokyo.
During this conference. Japan's oil import target for 1985 was set at 6,300,000
to (6,900,000 barrels per day. From a long-range viewpoint, Japan has little
hope to increase its import volume. Thus, it is anticipated that Japan will
face an increasingly stringent Supply-demand situation of energy.
1. 2 Energy Consumption Trend in Transportation
(1) Energy Consumption Structure of Transportation in Major Nations
Figure 14 shows the percentage
of transport volume and that of energy consumption volume by made of transportation
in major nations. Japan leads the rest of the world in transporting passengers
by rail. West Germany follows Japan. The United States is overwhelmingly an automobile
society. Air transport in the U.S. handles 11% of passenger traffic. In freight
transportation the situation is reversed. The US heads the rest of the world in
transporting freight by rail. In this mode. Japan even lags behind Britain, France
and West Germany. On the other hand, Japan is No. 1in terms of transporting freight
by ship which handles more than 50% of all cargoes in Japan. In contrast, the
share of cars in the energy consumption volume is generally larger than their
share in passenger or freight transportation. This is one of the reasons why all
major nations are trying to tackle the common problem of saving energy for automobiles.
An examination of per capita energy consumption volume in transportation of
major nations shows that Japan along with Italy has a low consumption level, about
2/3 of that for West Germany, Britain or France. In the US the per capita consumption
volume in transportation is about five times of that in Japan, although it may
not be fair to make a simple comparison between the two countries due to the difference
in land area and economic scale. (See
Figure 15.)
(2) Energy Consumption Trend in Domestic Transportation
Figure 16 shows the end-user
demand situation for domestic energy in transportation. The dependence on oil
has risen rapidly in line with the progress in motorization.
An examination of the trend in energy consumption by mode of transportation
shows that the energy consumption volume of automobiles in FY1977 was about nine
times that of FY1960, a heftier growth than the five-fold increase in total energy
consumption during the period. Also, its consumption share has increased from
36% to 64%. In contrast, the energy consumption level of railroads has declined,
and its share has declined from 32% to 6%. (See
Figure 17.)
(3) Energy Efficiency Rate by Mode of Transportation
Table 14 indicates the operating
energy consumption levels per transportation unit (passenger-kilometers, ton-kilometers)
by mode of transportation. Using an index of "one" for railroad, bus will be 1.5,
passenger cars 8.3 (private passenger cars 8.0), aircraft 7.6 (passenger), truck
6.4 and ship 1.2 (freight). On the whole, the transportation modes with good energy
efficiency rates are the mass-transport systems for passengers such as railroads
and buses, and also railroads and ships for freight transport.
There are other factors that must be considered when discussing energy efficiency
in transportation. When operating a transportation system, the energy consumed
is not limited to those used for moving or operating vehicles such as gasoline
or kerosene. Energy is also required to build and maintain roads, ports and harbors,
airports and other basic facilities, and to manufacture and repair cars, ships,
aircrafts and other transport equipments.
From this standpoint, the U.S. Congressional Budget Office in September 1977
submitted a report entitled "Urban Transportation and Energy" to the Senate Committee
on Environment and Public Works. This report gives the comparison of various transportation
modes in terms of wide range energy efficiency including operation energy efficiency
by using many average numerical factors obtained from the actual conditions of
American urban traffic. Moreover, a comparison is made between Japan and the United
States by analyzing the urban traffic situation in Japan with all methods possible
that were included in the report. (see
Table 15)
In private passenger cars and buses, the energy consumption volume in the US
in terms of door-to-door transport unit is 1.8 times of that in Japan. Presumably,
this difference arises from the difference in vehicle weight and speed between
the two countries. On railroads, the US volume is 13 times greater than that of
Japan's. Some of the possible reasons are as follows:
(i) The energy consumption rate for operating vehicles in the US is three times
of that in Japan.
(ii) Japanese railway vehicles have a greater traveling distance. And the frequency
in which various facilities are used is higher in Japan.
(iii) In the US about 70% of the passengers utilizing railroads must depend
on private passengers cars to reach the stations. The detour rate for using railroads
is more than 30% in the US In Japan, the detour rate is negligible.
(iv) The average number of passengers using railroads in Japan is four times
greater than in the US
As a result, the energy consumption rate in the US (kcal/passenger-kilometers)
is 100: 50:160 for electric train: bus: private passenger cars. Bus conserves
more energy than railroad. In Japan, however, the consumption rate is 100: 330:
1,110 for electric train: bus: private passenger cars. Therefore, in terms of
door-to-door comprehensive transportation energy, the railroad system in Japan
proves to excell over others in energy-saving characteristics. The results mentioned
above use average numerical factors. Therefore, it is necessary to make some allowances
for this. However, even when such marginal factors are considered, the fact that
railroads have superior energy efficiency cannot be changed. It can also be said
that the typical Japanese pattern of using railroads and buses as urban transportation
is also a highly energy-efficient transportation mode.
(4) Transport Industry in an Era of High Energy Cost
Following the political upheaval in Iran near the end of 1978, the import prices
of crude oil began to rise. This triggered a spiral in the domestic prices of
petroleum products. Finally in June 1979, the price of crude oil was increased
to over $20 per barrel by the OPEC conference in Geneva and prices continue to
rise. The impact is being felt in the transport industry. Supplies of fuel oil
are tightening. The available unit prices of various types of fuel oil in the
transport industry is increasing.