ü@ ü@The world economy in 1981 suffered from the aftereffects of the 2nd oil
crisis and the problems caused by high interest rates. Many advanced countries
were compelled to face business recessions or delays in business recovery. Unemployment
rose sharply. There was a general trend toward business slump in developing
countries, too. In these circumstances, protectionist pressure has mounted in
many countries.
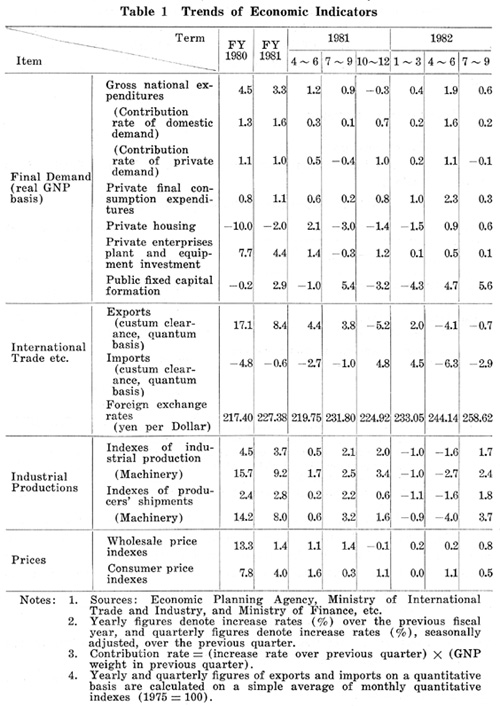
ü@ ü@The Japanese economy showed a better performance than those of other advanced
countries as far as prices and the balance of payments were concerned. Domestic
demand, however, remained relatively weak, and exports slowed down in the latter
half of fiscal 1981. Business recovery made no headway. As a result, the real
economic growth rate remained 3.3%, the lowest since fiscal 1974 (-0.2% ) (Table
1). Since the oil crisis, there have been imbalances in business performance,
as reviewed by industry's type, scale and region.
ü@
(1) Passenger transport
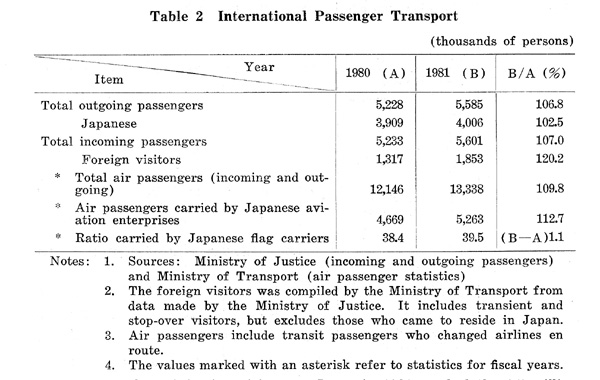
ü@ ü@The Trend of international passenger transport in Japan in fiscal 1981 is
shown in Table 2.
ü@ ü@The number of foreign visitors to Japan in 1981 reached the 1.5 million mar
k for the first time, and the rate of increase was the highest since 1970 when
the World Exposition was held in Osaka. This increase was due to the following
factors:
ć@ The number of visitors from Southeast Asia increased sharply ;
ćA Prices remained relatively stable in Japan ;
ćB Foreigners had the feelings that a visit to Japan cost relatively less because
of the yen's fall against the dollar.
ü@ ü@By region, there were many visitors from the United States, Taiwan, and the
Republic of Korea.
ü@ ü@The number of Japanese who visited foreign countries rose gradually despite
the low yen rates, and reached the 4 million mark, the same level as 1979. Their
popular destinations included Taiwan, Hawaii, the Republic of Korea and other
countries in the Asia-Pacific region, which are geographically close to Japan
and can be visited at relatively low costs. Particularly, the number of visitors
to Singapore and Malaysia rose sharply.
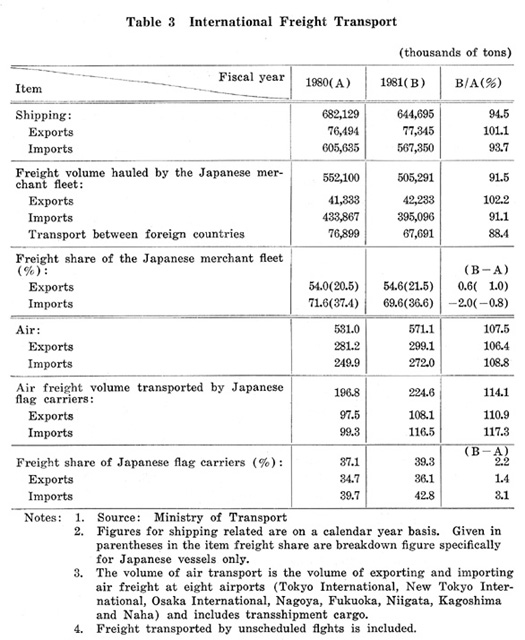
(2) Freight transport
ü@ ü@Japan's international freight transport by ocean-going shipping in fiscal
1981 (on a tonnage basis) marked a slight increase as far as exports were concerned.
By item, steel fell because of the worldwide slump in demand. Passenger cars
slowed down their increase rate due mainly to trade frictions.
ü@ ü@Imports also dropped. By item, almost all imports, excluding coal, marked
decreases. Noticeable were declines in iron ore, wood and crude oil due to slumping
domestic demand.
In international air freight transport, exports fell sharply in their growth
rates. Of particular note is that precision instruments and electrical machinery
fell from the previous fiscal year. These products have been rising sharply
and have supported the growth of air freight transport. Imports marked increased
growth rates (Table 3).
Note: The JNR Reconstruction Promotion Special Law (promulgated and enforced on December 27, 1980) This Law is aimed at laying a foundation for the sound management of the JNR by fiscal 1985, and thereafter at enabling the JNR to restore a financial balance as quickly as possible. As the necessary legal steps for these purposes, the Law provides for the following measures :
| ć@ | In order to carry out the management improvement plans without fail, the JNR should work out and implement a management improvement program, examine the progress of the implementation for each fiscal year and revise the program if necessary. |
| ćA | Local lines should be rationalized thoroughly, and a special fare system for these lines should be introduced. Some special local lines should be switched to buses or other appropriate means of transportation after consultations with the Special Local Line Council which has been set up for each special local line. |
| ćB | As part of the assistance to the JNR, the Government should shelve the repayment of ~5,059.9 billion, which is part of JNR's accumulated debts. |
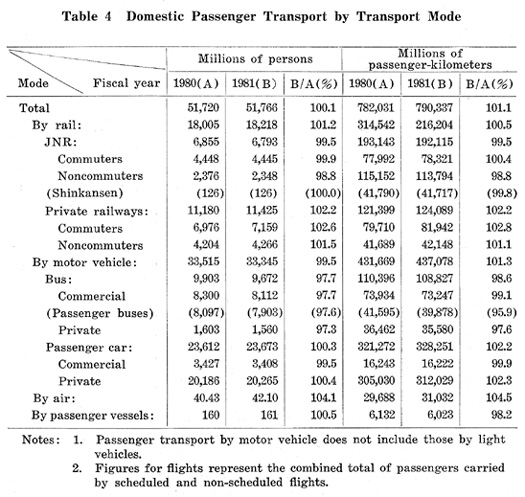
(1) Passenger transport
ü@ ü@Passenger transport in fiscal 1981 marked low growth rates due to stagnant
consumption. The number of passengers totaled 51,766 million, an increase of
only 0.1% Over the previous fiscal year. Passenger-kilometerage in fiscal 1981
totaled 790,337 million, a1.1% increase over the previous fiscal year
(Table 4).
ü@ ü@Of particular note in fiscal 1981 are üE air transport, which fell in fiscal
1980 for the first time in 14 years, went upward again; üE excluding the private
railways and air, transport by the JNR, buses, passenger cars and passenger
boats either declined or leveled off at almost the same rates.
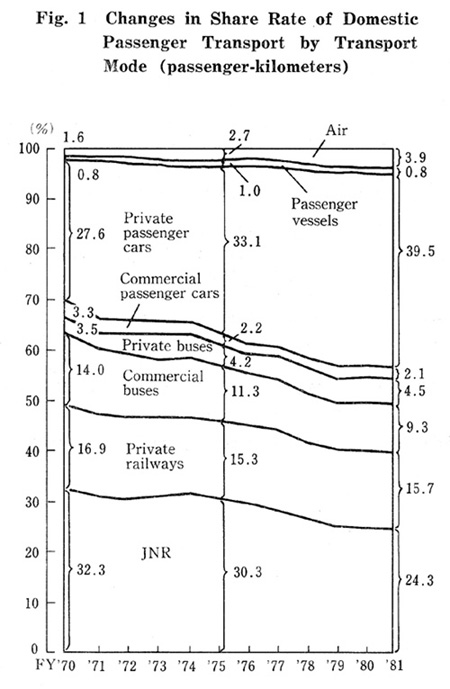
ü@ ü@The share of passenger-kilometerage by mode of transport shows that while
passenger cars, the private railways and air rose, the JNR and buses dropped.
The share was 41.6% for passenger cars (of these, 39.5% for cars for personal
use), 24.3% for the JNR, 15.7% for the private railways, 13.8% for buses, and
3.9% for air (Fig. 1).
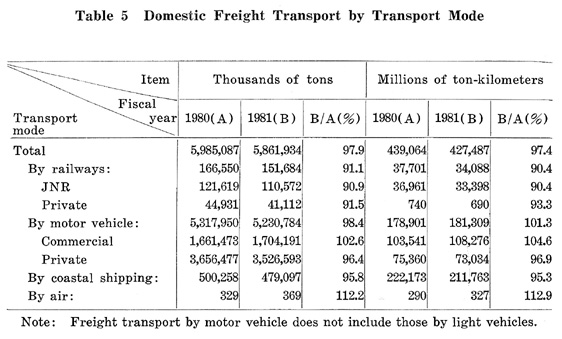
(2) Freight transport
ü@ ü@Freight transport in fiscal 1981 suffered the worst slump since the first
oil crisis due to drawn-out business stagnation. Transport tonnage in fiscal
1981 totaled 5,861,934 thousand, a 2.1% decrease from the previous fiscal year.
This decrease was the first in five years since fiscal 1976. Transport ton-kilometerage
totaled 427,487 million, a 2.6% decrease from the previous fiscal year. The
decrease continued from the previous fiscal year (Table
5).
ü@ ü@Of particular note in fiscal 1981 are üE excluding air, all transport systems
suffered declines either at the same rates as or at higher rates than the previous
fiscal year ; and üE the JNR continued to suffer a long-term, declining trend
and marked a sharp drop of 10% Or so in fiscal 1981, too.
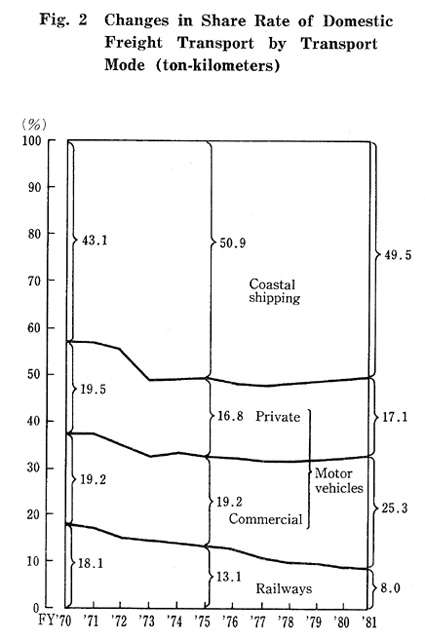
ü@ ü@The share of ton-kilometerage by mode of transport shows that, while automobiles
for business purposes rose, coastal shipping, railways and automobiles for personal
use declined. The share was 49.5% for coastal shipping, 42.4% for automobiles
(25.3% for business and 17.1% for personal use) and 8.0% for railways (Fig.
2).